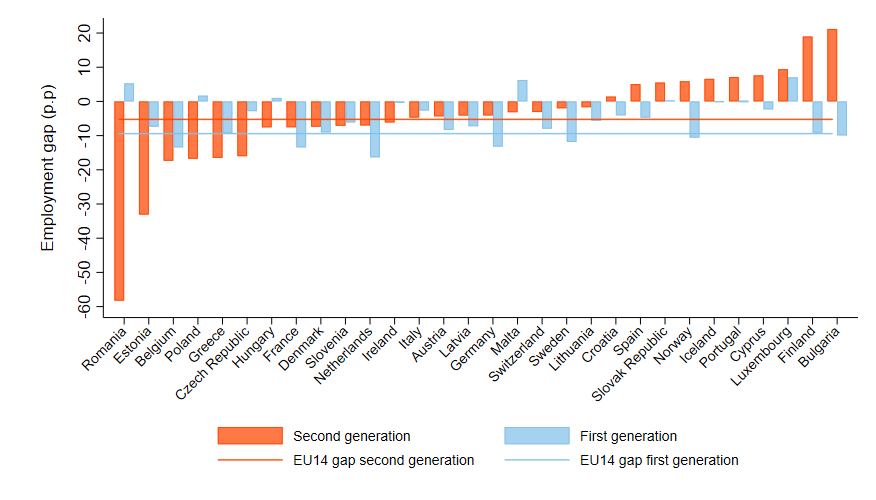
In all countries with a significant migrant population, second-generation immigrants have a higher probability of employment than first-generation immigrants, but generally remain less likely to be employed than natives with native-born parents. On average, across the EU14, second-generation immigrants are 5 percentage points less likely to have a job than natives, while the employment gap is 9 percentage points for first-generation immigrants (Figure 1). However, these averages mask substantial cross country differences in both directions.
In some countries, second-generation immigrants outperform natives in terms of employment rates. This is the case in Luxembourg, Norway, and Portugal, where they are more likely than natives to be employed, with employment advantages of 9, 6, and 7 percentage points, respectively. Conversely, in countries like Belgium (-17 p.p.), France (-8 p.p.), and the Netherlands (-7 p.p.), the employment disadvantage of second-generation immigrants compared to natives is substantially larger than the EU14 average. In Belgium, this gap is particularly striking, as second-generation immigrants face an even larger employment disadvantage relative to natives (-17 p.p.) than first-generation immigrants do (-13 p.p.).
Figure 1: Second generations have a higher probability of employment than first generations
Differences in employment probability between natives and first- or second-generation immigrants, age 25-64 (2023)
The employment gap between second-generation immigrants and the descendants of natives cannot be explained by differences in age, gender, or education profiles. Even after accounting for these factors the overall employment gap across EU14 countries remains unchanged.
Notably, in countries such as France and the Netherlands, the labour market disadvantage of second-generation immigrants actually increases when they are compared to natives with the same age, gender, and education profile. This suggests that their employment gap is not driven by demographic or educational differences but rather by factors linked to their immigration background.
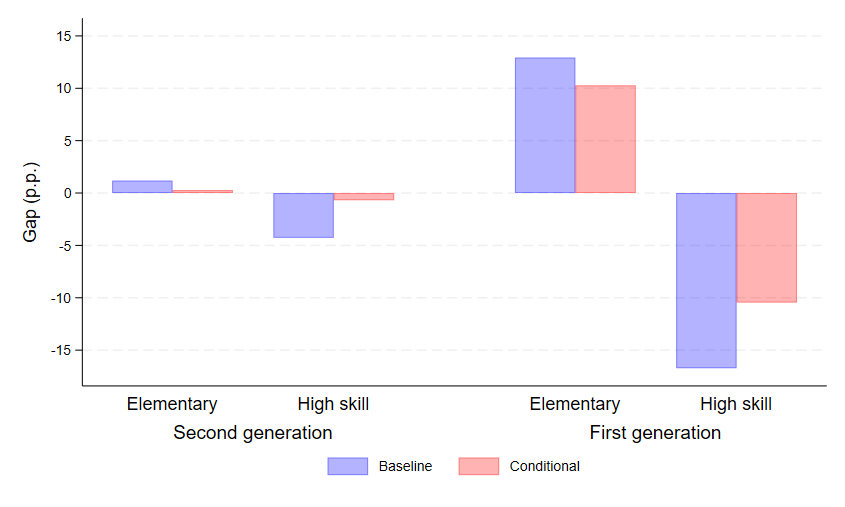
Second-generation immigrants are not only less likely to be employed than natives, but those who do find work are also more likely to be in low-skilled, low-paid jobs. Specifically, they are one percentage point more likely than natives to be employed in an elementary occupation (Figure 2). Given that 6% of employed natives work in such roles, this means that second-generation immigrants are 20% more likely than natives to hold a low-skilled job. However, there are notable differences between the descendants of EU and non-EU immigrants. Among the descendants of EU immigrants, the likelihood of working in an elementary occupation is no different from that of natives with native-born parents. By contrast, the offspring of non-EU immigrants face a higher probability of being employed in low-skilled jobs. Importantly, for both EU and non-EU second-generation immigrants this occupational disadvantage can be entirely explained by differences in age and, especially, education levels. In other words, the lower educational achievements of second-generation migrants are responsible for their lower occupational status.
A similar pattern emerges at the top end of the occupational scale. Second-generation immigrants are 4 percentage points less likely than natives to hold a high-skilled job. Across EU14 countries, 49% of natives work in highly skilled occupations, meaning that second-generation immigrants are 9% less likely than natives to secure such roles. Although this gap is smaller among the descendants of EU immigrants (-3 p.p.) than among those of non-EU immigrants (-5 p.p.), it remains statistically significant for both groups. However, in both cases, the difference disappears entirely once age, gender, and education levels are taken into account, highlighting again the role of educational disadvantage in explaining labour market penalties.
Figure 2: Second generations are more likely to work in “elementary occupations” and less likely to work in “high skill” occupations than natives, but mostly due to their lower educational achievements
Differences in the probability of having an elementary or high skill occupation between natives and first- or second-generation immigrants in EU14 countries, age 25-64 (2023)
So far, we have examined the labour market situation of second-generation immigrants in terms of employment probability and occupational status, focusing on individuals aged 25-64-an age range where most people have completed their education and remain active in the labour market. However, in most European countries, only a small proportion of second-generation immigrants fall within this age group. In EU14 countries, around 70% of second-generation immigrants are under 30, with 27% aged 15-29. In contrast, these figures are 32% and 18% for natives, and 23% and 17% for first-generation immigrants, respectively. This means that a disproportionately large share of second-generation immigrants is still in education or has only recently entered the labour market.
For this younger cohort, a key indicator to consider is the NEET rate-the share of 15-29-year-olds who are neither in employment, education, nor training. This age range is critical, as it marks the transition from education to work, and ensuring a smooth transition is essential to prevent disengagement from both education and the labour market. Recognising its importance, the European Union, through the European Pillar of Social Rights Action Plan, has set a target to reduce the NEET rate to below 9% across the EU by 2030. As of 2023, this goal was almost met among natives with native-born parents, who had an average NEET rate of 10% across the EU. However, second-generation immigrants faced a significantly higher NEET rate, exceeding that of natives by 2 percentage point-a difference of 20%.
Figure 3: Countries with a higher NEET share among natives also display high NEET share among second-generation immigrants
Share of natives and second-generation immigrants aged 15-29 neither in employment nor in education or training (2023)
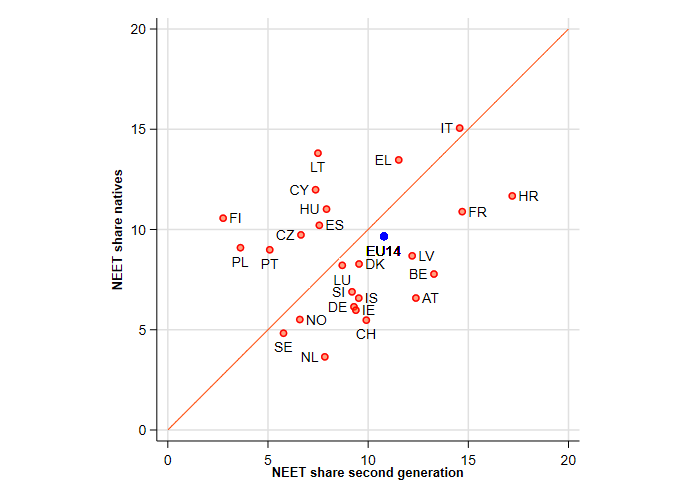
NEET rates vary considerably across countries. In the Netherlands (4%), Sweden (5%), Ireland, and Germany (6%), young natives with native-born parents already have NEET rates well below the EU’s 2030 target. Conversely, in countries such as Romania (19%), Italy (15%), Lithuania (14%), and Greece (13%), the NEET rate among natives is still well above the EU target. In general, the data show a clear correlation: countries with higher NEET rates among natives also tend to have higher NEET rates among second generation immigrants (Figure 3).
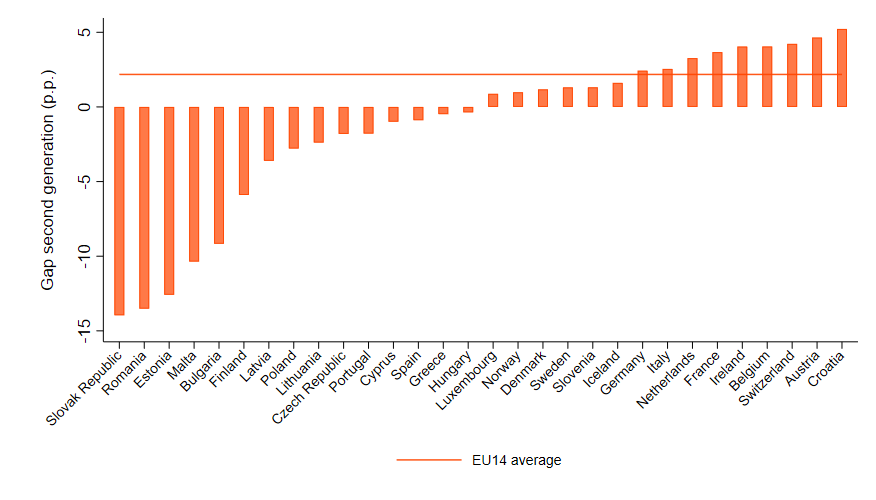
Interestingly, in all countries with a significant presence of second generation immigrants, they consistently display a higher NEET share than natives (Figure 4). Italy presents a particularly notable case. While it has one of the highest NEET rates among its native population, the rate is not significantly higher among second-generation immigrants. However, once differences in age structure are taken into account-recognising that second generation immigrants are more likely to still be in compulsory education-a clearer pattern emerges. After adjusting for age, education, and gender, second-generation immigrants in Italy are actually 2.5 percentage points more likely to be NEET than their native-born peers of the same profile.
Figure 4: In most countries, second generation immigrants are more likely to be NEET than natives of the same age
Differential in the probability of being neither in employment nor in education or training between natives and second-generation immigrants, accounting for differences in age, gender and education (2023)
There are significant differences between EU and non-EU second generation migrants in terms of NEET rates. On average across EU countries, second generation EU migrants have a NEET share identical to that of natives. In contrast, non-EU second-generation migrants are 2.5 percentage points more likely than natives to be neither in employment, education, nor training-a 25% higher probability.