Since large-scale immigration is a relatively recent phenomenon in many European countries, second-generation immigrants make up a smaller share of the population compared to first-generation immigrants. In 2023, 4% of the European population aged 0-74 were second-generation immigrants, while an additional 5% had a mixed background, meaning they had one foreign-born and one native-born parent. In contrast, 13% of the population in this age group were foreign-born. These shares are slightly higher in EU14 countries, where second-generation immigrants and individuals with a mixed background each account for approximately 6% of the population, while first-generation immigrants make up an additional 16% of residents (Figure 1). Notably, the share of second-generation immigrants is even lower-and the share of first-generation immigrants higher-when we focus on the working-age population (25-64). This reflects the fact that many second-generation immigrants and individuals of mixed background are still relatively young and often still in education, a point we explore later in the report.
Figure 1: Second generation immigrants account for 6% of the population in EU14 countries
Share of first- and second-generation immigrants in the total 0-74 population (2023)
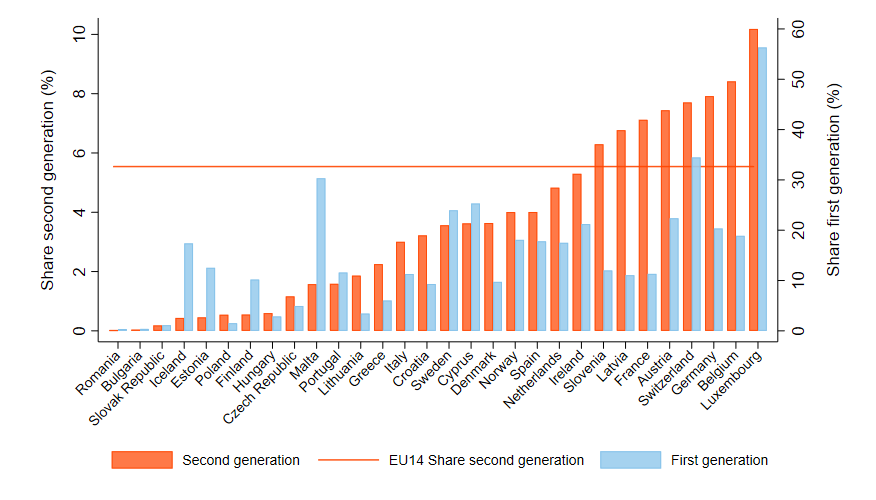
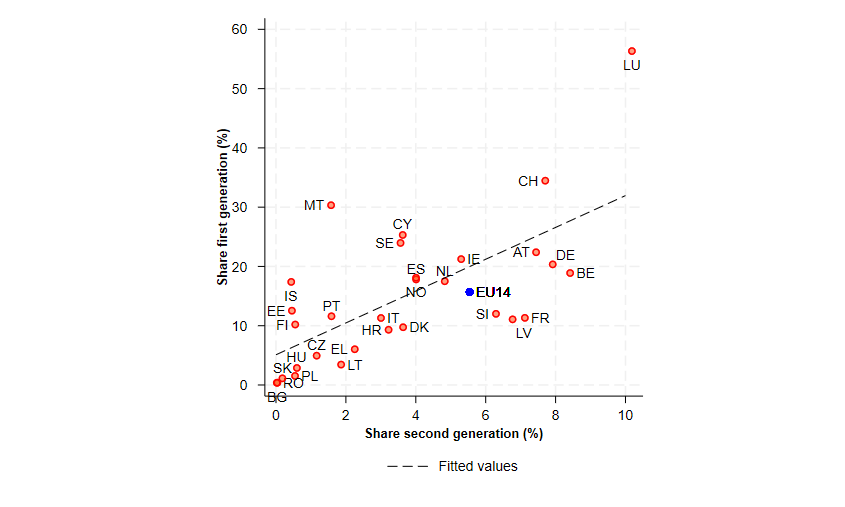
These average figures mask substantial variation across countries. The highest shares of second-generation immigrants are found in Luxembourg (10%), followed by Belgium, Germany, and Switzerland (8%), and Austria and France (7%). In contrast, the second-generation population is negligible-no more than 1%-in most Central and Eastern European countries. The share remains low in Malta, Portugal, Lithuania, and Greece (around 2%), and reaches 3% in Italy. Unsurprisingly, these cross-country differences largely mirror variations in the size of the first-generation immigrant population, as shown more clearly in Figure 2.
Figure 2: Countries with a higher immigrant presence also display a higher concentration of second-generation immigrants
Share of first- and second-generation immigrants in the total 0-74 population (2023)
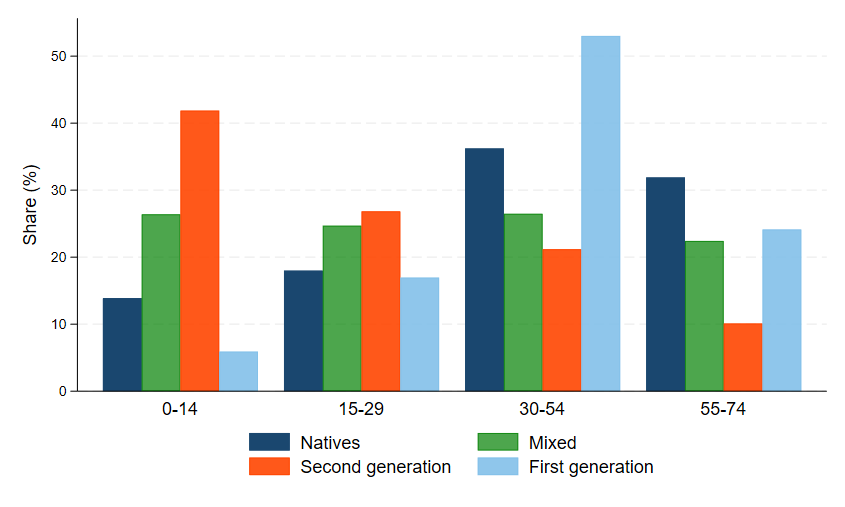
As noted earlier, second-generation immigrants tend to be significantly younger than their first-generation counterparts. Across Europe, their average age is 25 (24 in EU14 countries), compared to 42 for first-generation immigrants (also 42 in EU14 countries) and 40 for natives (41 in EU14 countries).
Figure 3 illustrates the age distribution of different population subgroups in EU14 countries, revealing stark differences between them. Most second-generation immigrants are very young, with 42% aged 0-14 and an additional 27% between 15 and 29. Their age structure contrasts sharply with that of first-generation immigrants, the majority of whom are between 30 and 54 years old (53%), while 24% are aged 55-74. The age distribution of natives with native-born parents is even more skewed towards older age groups, with 36% aged 30-54 and 32% falling within the 55-74 range.
These differences in age composition highlight the distinct demographic profiles of the three groups, shaping their educational attainment, labour market participation, and the long-term workforce composition of European countries.
Figure 3: Most second-generation immigrants are young, or children
Age distribution of natives, individuals of mixed background, second- and first-generation immigrants in EU14 countries (2023)
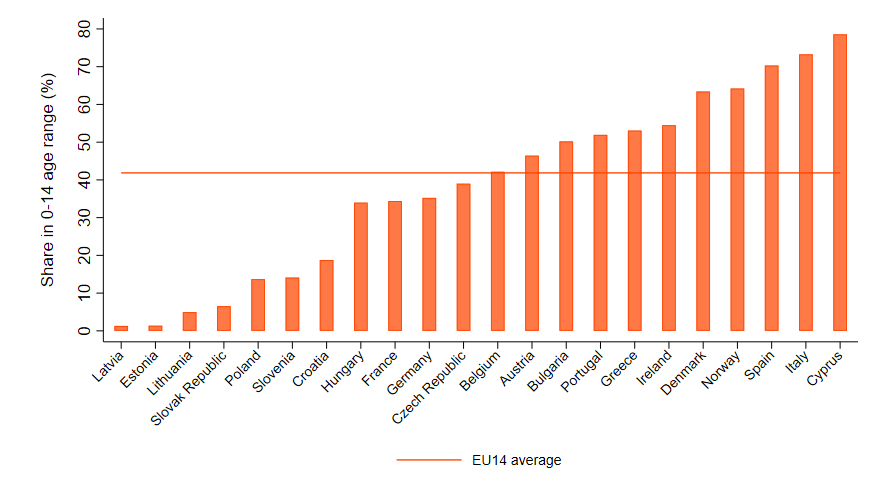
Among individual countries, Cyprus (79%), Italy (73%), and Spain (70%) have the highest concentrations of second-generation immigrants in the 0-14 age group. In contrast, Germany and France have much lower shares, with only 35% and 34% of second-generation immigrants under the age of 15 (Figure 4). This difference reflects the longer immigration history of Germany and France, where many second-generation immigrants belong to older cohorts, unlike in countries where immigration is a more recent phenomenon.
Figure 4: More than 40% of second-generation immigrants are younger than 15
Share of second-generation immigrants in the 0-14 age range (2023)
Although many second-generation immigrants are still in full-time education, we can compare the educational attainment of those who are old enough to have reasonably completed their studies with that of first generation immigrants and natives in the same working-age group (25-64 years old).
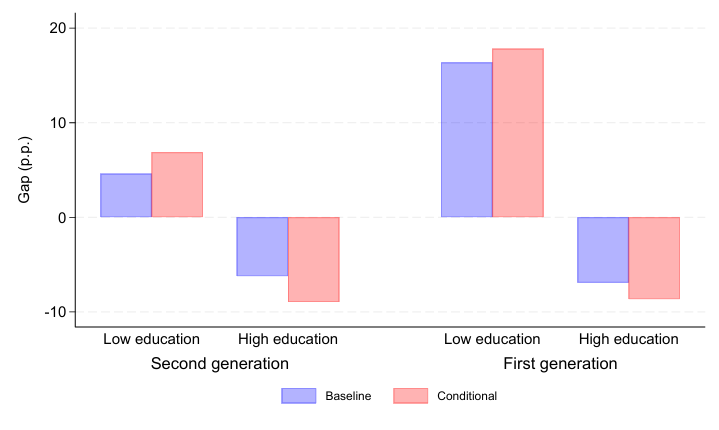
Across the EU14, second-generation immigrants are 6 percentage points less likely than natives to have attained tertiary education (Figure 5). Given that in 2023, 37% of natives in EU14 countries had a university degree, this means that the likelihood of second-generation immigrants obtaining tertiary education is 16% lower than that of natives. Notably, first-generation immigrants face a similar disadvantage, with a 7 percentage point gap compared to natives. In both cases, this disparity widens to 9 percentage points when differences in age and gender composition are taken into account. This is largely due to the younger age profile of both first- and second-generation immigrants compared to natives, as well as the higher rates of tertiary education among younger cohorts.
At the lower end of the educational spectrum, second-generation immigrants are almost 5 percentage points more likely than natives to have only lower-secondary education or less. Since 21% of natives in EU14 countries fall into this category, this implies that second-generation immigrants are 24% more likely than natives to have low education levels. As before, adjusting for differences in age structure, the gap widens to seven percentage points.
However, unlike for tertiary education, the gap in low educational attainment is substantially larger for first-generation than for second-generation migrants. First-generation immigrants are 16 percentage points more likely than natives to have low education levels, making their disadvantage 3.5 times larger than that of second-generation immigrants.
Figure 5: Second generation immigrants are more educated than first generations
Differences in the probability of having a low or high education between natives and first- or second-generation immigrants in EU14 countries, age 25-64 (2023)
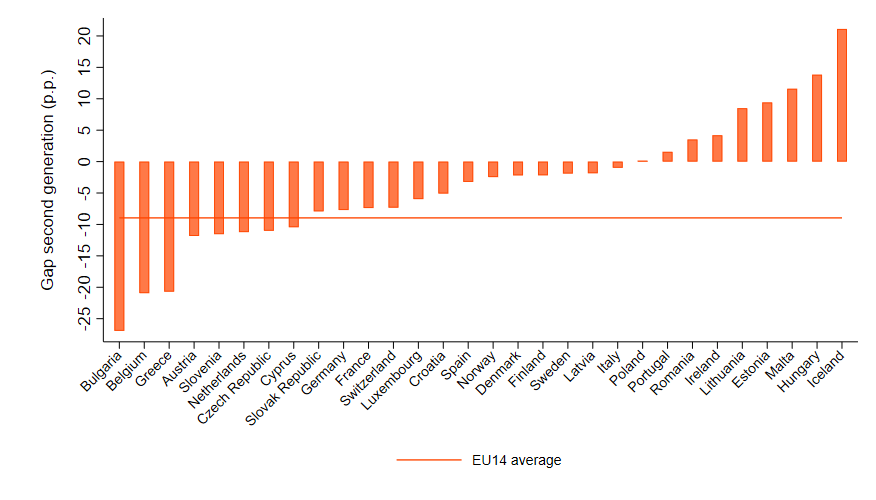
Italy stands out as the only country where second-generation immigrants have a notably higher probability of attaining tertiary education than natives, with a seven percentage point advantage. However, this difference entirely disappears once age structure is taken into account. As Figure 6 illustrates, when comparing second-generation immigrants and natives of the same age, their likelihood of holding a university degree is virtually identical. This pattern is not observed in most other countries where second generation immigrants make up a significant share of the population. In fact, in the majority of cases, second-generation immigrants continue to have lower tertiary education rates than their native peers.
Figure 6: Second generations have a lower probability of tertiary education than natives
Differential probability of having tertiary education between natives and second-generation immigrants, accounting for differences in age and gender, age 25-64 (2023)
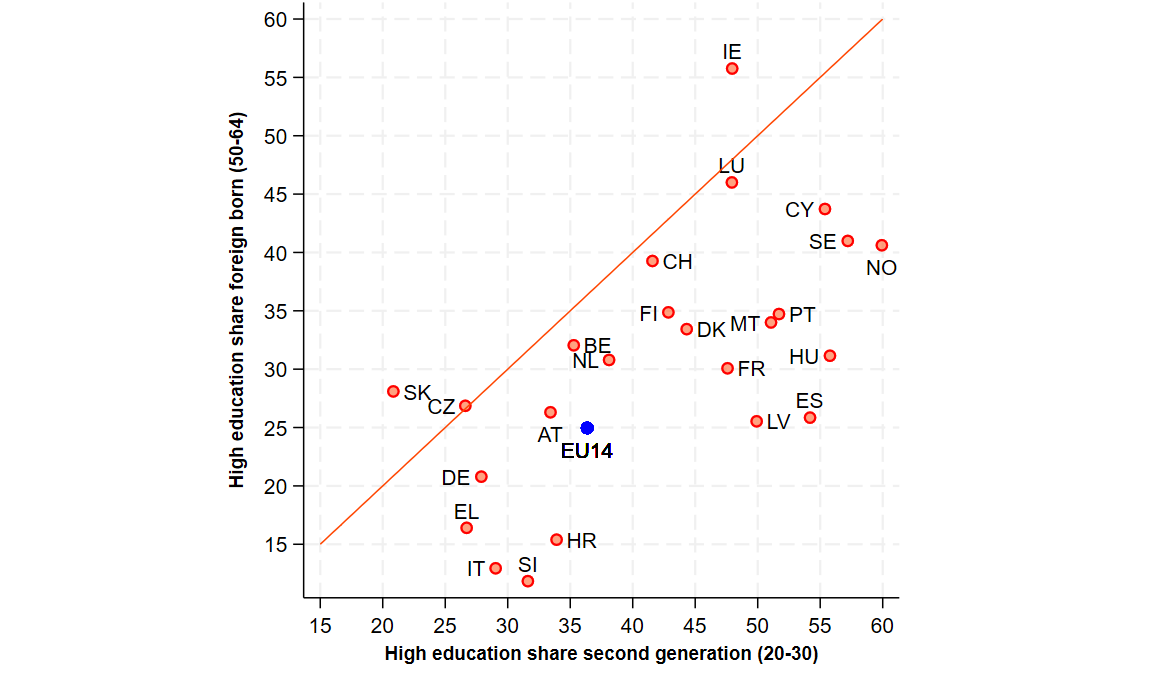
Although it may be tempting to interpret differences in educational attainment between first- and second-generation immigrants as a sign of intergenerational mobility, this interpretation is misleading. First-generation immigrants include individuals of all ages who have spent varying lengths of time in the host country, and many of them do not have children born there. While our data do not provide direct information on parental education, we can approximate the intergenerational comparison by examining the tertiary education rates of different generations. Figure 7 illustrates this by plotting, for each country, the share of first-generation immigrants aged 50-64 (the “parent generation”) with tertiary education against the share of second-generation immigrants aged 25-34 (the “children’s generation”) who have attained the same level of education.
The results reveal substantial educational progress among second generation immigrants in almost every country. In some cases, the increase is particularly striking, with tertiary education rates more than doubling between generations. This is most evident in Italy (29% vs 13%) and Spain (54% vs 26%), where second-generation immigrants have achieved significantly higher levels of education than the previous generation. However, it is important to note that this educational improvement is not unique to second-generation immigrants—it reflects a broader trend towards higher education levels among younger cohorts, a pattern observed among both natives with native-born parents and second-generation immigrants alike.
Figure 7: Second-generation immigrants are considerably more educated than their parents’ generation
Share of first-generation immigrants aged 50-64 (“parent generation”) with high education vs share of second-generation immigrants aged 25-34 (“children generation”) with high education (2023)