Between 2015 and 2024, migrants became an increasingly structural component of European societies. In EU14 countries, migrants represented 12.1% of the population in 2015; by 2024 this share had risen by 3.5 percentage points (more than 12 million additional foreign-born residents), reaching 15.5%. This means that roughly one in six residents in EU14 countries is now foreign-born.
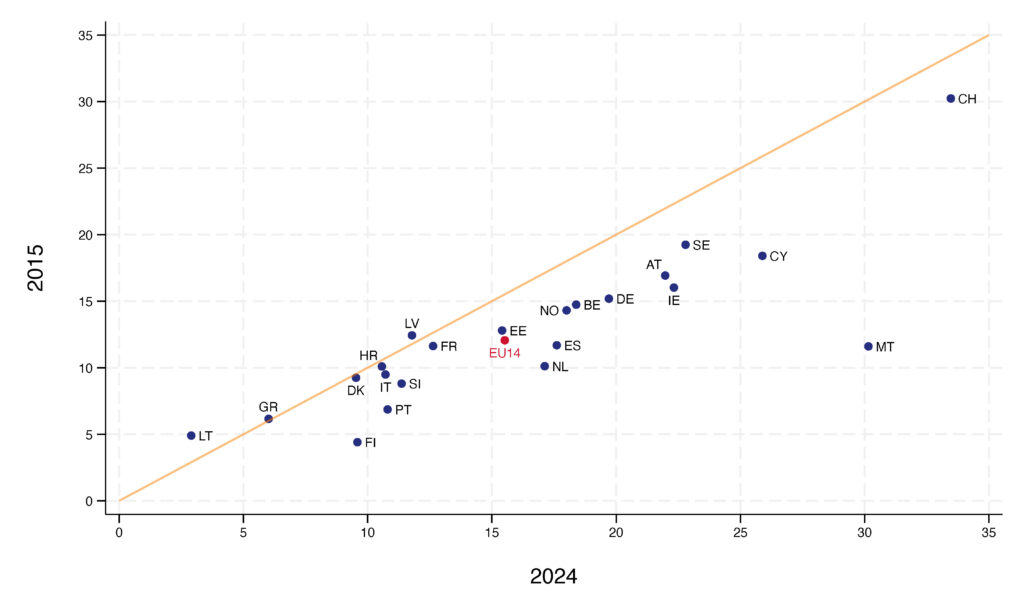
The increase was not uniform across countries (Figure 1). The increase is largest in Malta (19 percentage points), followed by Cyprus (almost 8 percentage points), Ireland and Spain (around 6 percentage points each). In Croatia, Denmark, France, and Italy, by contrast, the migrant share changed only marginally (almost one percentage point), while in Greece it remained broadly stable. Latvia and Lithuania, instead, saw the presence of immigrants in their population decline by around one and two percentage points, respectively. These contrasting trajectories indicate that while the overall European trend points towards greater demographic relevance of migrants, national experiences differ markedly.
Figure 1: Growth in migrant presence varies substantially across countries
Migrant share in 2015 and in 2024 across European countries
In general, the foreign-born population is still primarily concentrated in Western European countries. When considering all EU27 countries, the increase in the share of immigrants in the population has been therefore slightly lower than in the EU14, from 9.7% in 2015 to almost 13% in 2024.
Changes in the size of the migrant population were accompanied by important shifts in its composition. These shifts concern both the geographical origin of migrants and their educational attainment. Understanding these transformations is crucial for interpreting subsequent labour market outcomes.
At the EU14 level, migrants born in another EU country accounted for 35% of the foreignborn population in 2015. By 2024, this share had fallen to less than 28%, a decline of almost eight percentage points (or 22% of the initial share), as we show in Figure 2.
Figure 2: Migrants’ origin shifted away from predominantly EU
Distribution of migrants by area of origin in EU14 countries, 2015 and 2024
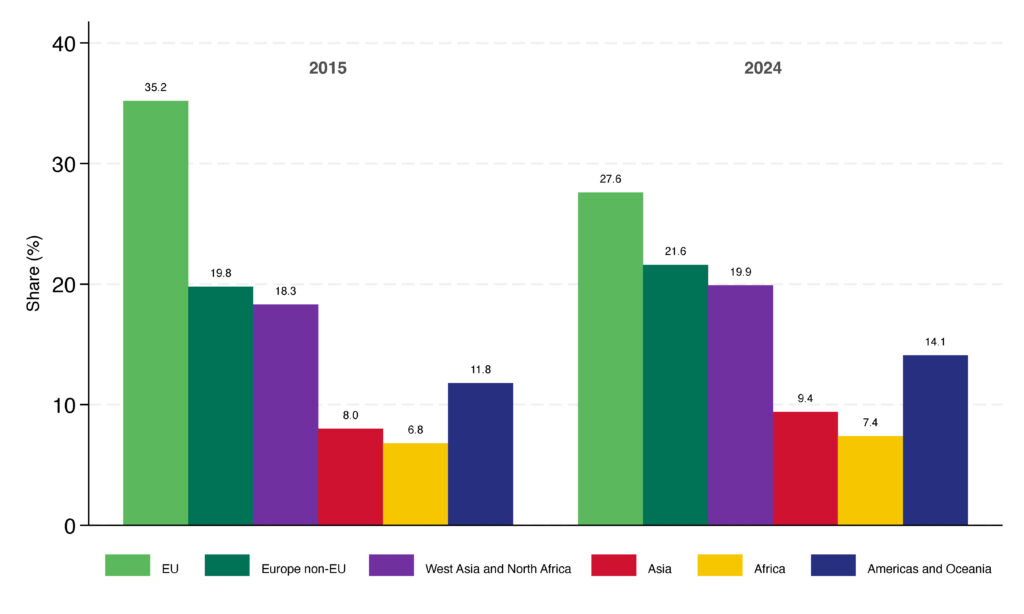
At the same time, migrants originating from West Asia and North Africa represented18% of immigrants in EU14 countries in 2015 and increased to 20% in 2024. While this aggregate rise of two percentage points (10% of the initial share) is moderate, it masks very large country-specific changes. In Germany, the share of migrants from this area rose from 8% to 20%, an increase of 12 percentage points, equivalent to a 150% growth.
In Austria, it increased from 5% to 11%, a rise of six percentage points, or a 120% growth.
These developments are consistent with the large inflows of asylum seekers from Syria and Afghanistan after 2015, which were not evenly spread across EU countries.
A further important shift concerns migrants from the Americas. At the EU14 level, their share increased from less than 12% in 2015 to 14% in 2024 (a 19% increase). This change was particularly pronounced in Spain, where migrants from the Americas rose from 37.5% to 49% of the foreign-born population, an increase of almost 12 percentage points (a 31% increase), reflecting especially the large outflow of refugees from Venezuela.
In other countries, including Luxembourg and Ireland, intra-EU mobility remained central despite its relative decline. By contrast, in some Eastern European countries, the composition of migrants remained relatively stable, reflecting more limited inflows overall. Figure 3 displays percentage point changes in the share of non-EU migrants in the total foreign-born population for each European country.
Figure 3: The composition of migrant origins evolved unevely across Europe
Change in the share of non-EU migrants between 2015 and 2024, by country
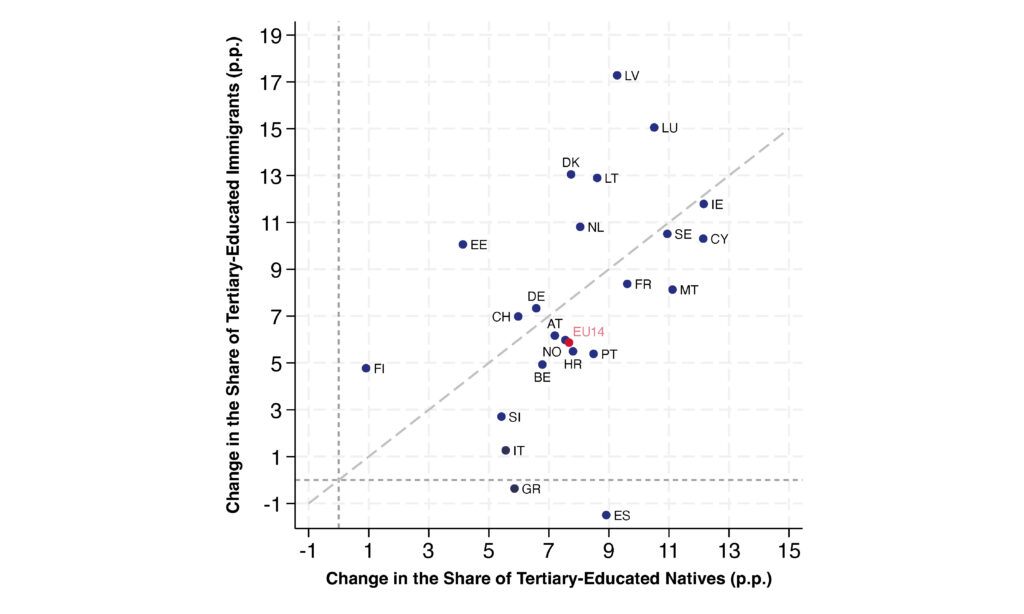
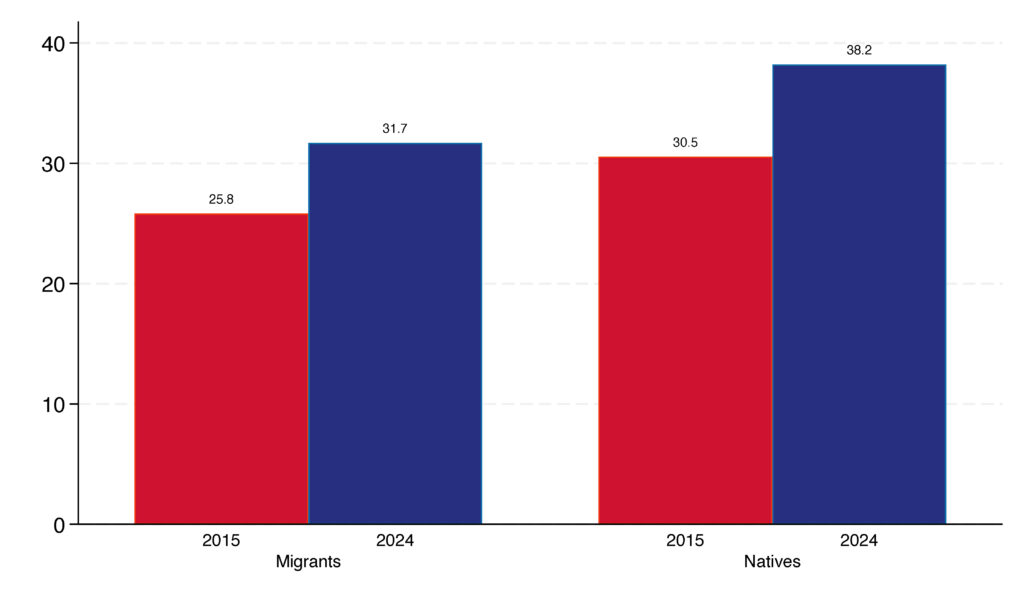
Educational attainment among migrants improved over the decade, but not uniformly across countries and not necessarily relative to natives. In EU14 countries, the share of tertiary-educated migrants increased from around 26% in 2015 to 32% in 2024, a rise of almost six percentage points, equivalent to a 21% growth. However, over the same period, the share of tertiary-educated natives increased too, from about 30% to 38% – a rise of eight percentage points, or 26% (Figure 4). As a result, the relative education gap between migrants and natives did not narrow but widened.
Figure 4: Educational upgrading occurred among both migrants and natives
Share of tertiary educated natives and migrants across EU14 countries, 2015 and 2024
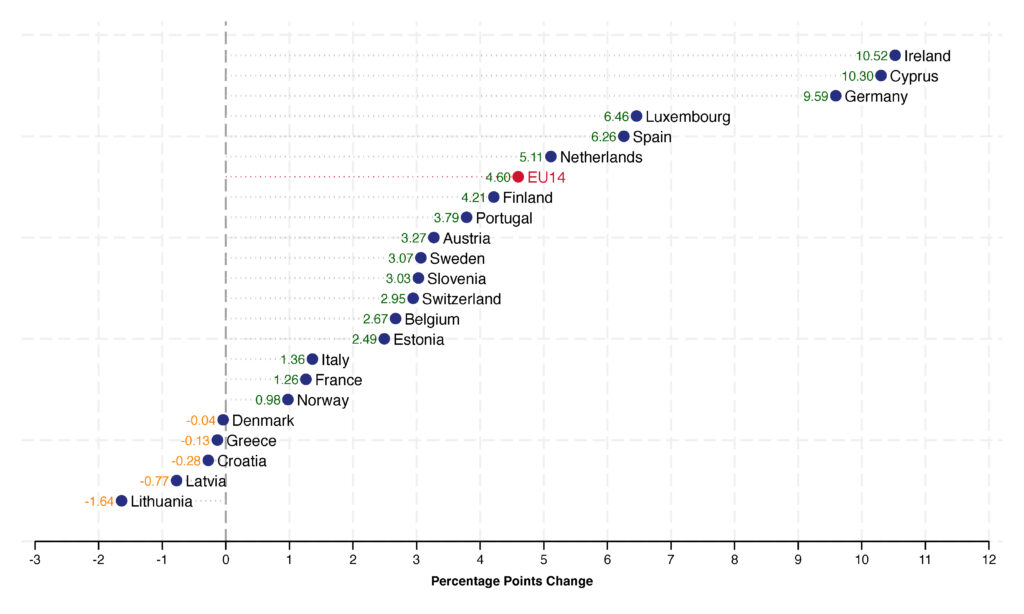
Country patterns differ markedly, as we show in Figure 5. In Latvia, the share of tertiary educated migrants increased by 17 percentage points; in Denmark and Luxembourg, by more than 13 and 15 percentage points, respectively. By contrast, in Italy the increase was limited to one percentage point, while in Greece the share declined slightly. In several countries, including Belgium and France, migrants’ educational upgrading was substantial but still smaller than that of natives, implying widening or stable relative gaps.
In a smaller group of countries, migrants experienced stronger educational gains than natives, suggesting some degree of convergence. However, in most EU14 countries the increase in tertiary attainment among natives matched or exceeded that of migrants.
This indicates that educational upgrading over the decade reflects broader structural change rather than a migrant-specific improvement.
Figure 5: Relative educational upgrading shows strong cross-country heterogeneity
2015-2024 change in the share of tertiary-educated migrants and natives, by country